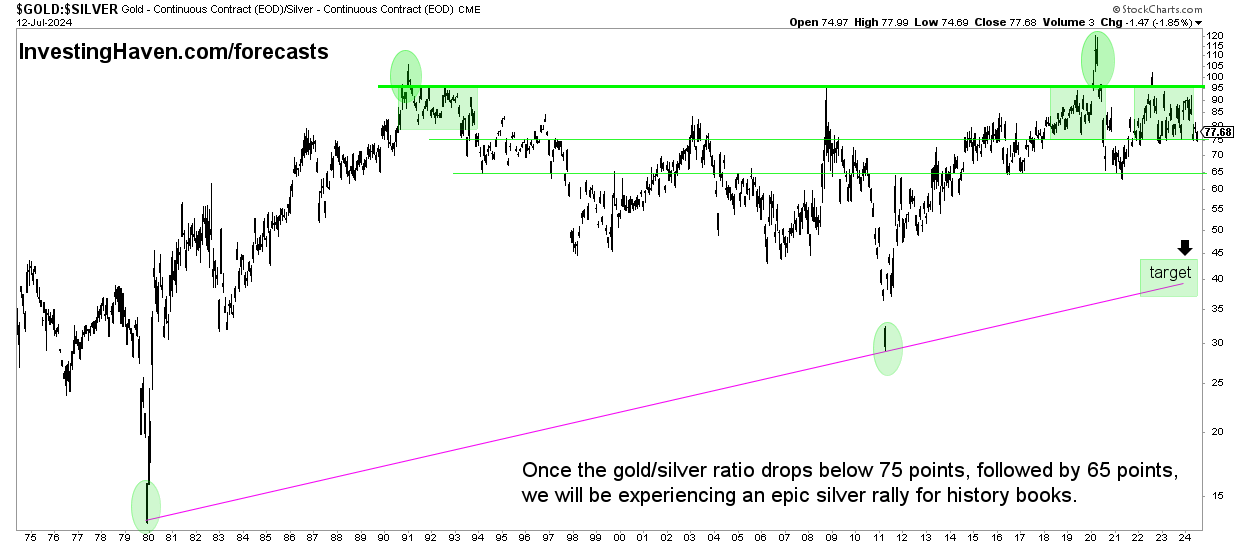
Since the beginning of July 2024, the gold-silver ratio graph has fallen almost 70 points. A small push in the price of silver and this relationship will break down, creating bullish energy in the silver market.
RELATED – A Gold Price Prediction for 2025 to 2030
We investigate a fascinating phenomenon related to the gold-silver ratio. Naturally, the gold-silver ratio chart concludes that silver has the potential to create epic price swings from time to time. They tend to result in epic silver rallies that will go down in the history books.
By analyzing historical data and observing the pattern, we notice the potential for significant price movement in silver when the ratio drops below 80 to 100x.
Understanding the gold-silver ratio
The gold-silver ratio is a simple measure that compares the price of gold to that of silver. It is calculated by dividing the price of gold per ounce by the price of silver per ounce.
Historically, this ratio has seen significant fluctuations, influenced by several factors, including market sentiment, economic conditions, and supply and demand dynamics.
However, epic turning points have been recorded in the 80-100 point range. More importantly, every drop below 80 points was accompanied by strong silver price action.
July 16, 2024 – The big level to watch out for for the gold-silver ratio is 65 points: Once below 65 points, silver has historically been able to stage a historic rally. However, very often, 65 points in the gold-silver ratio acted as support, meaning resistance in the price of silver. With a gold price stable around USD 2340/oz, a gold-silver price ratio is created 34-37 USD/oz for silver as THE decisive price. This is consistent with all of our silver analysis to date, where we have always identified $34.70/oz as the critical price point (also the first bullish silver target).
September 4, 2024 – The gold-silver price ratio continues to fluctuate around 80 points. Silver had a great opportunity to stage an epic rally, following silver’s breakout in April, which pushed the gold-silver ratio into the 75-point area (a key decision point for an accelerated rise in silver prices). However, the time was not yet right: the market was not yet ready for silver to move to ATH.
The phenomenon of epic silver rallies
Over the past fifty years, a pattern has emerged in the ratio of gold to silver that is catching the attention of astute investors. Whenever the ratio crosses into the 80x100x range, it has consistently preceded epic rallies in the price of silver. Let’s examine four notable examples where this pattern unfolded: 1991, 2002, 2009, and 2020.
- 1991: A catalyst for the rise of silver. In 1991, the ratio exceeded the 80 to 100x range, representing an excellent opportunity for investors. Following this event, silver staged an impressive rally, with prices soaring in subsequent years. The surge demonstrated the potential for significant returns and highlighted the importance of recognizing patterns within the precious metals market.
- 2002: Silver’s secular bull run. Another notable example occurred in 2002, when the ratio again reached the 80 to 100x area. Silver responded with a monumental rally, reinforcing the idea that this range acted as a catalyst for the white metal’s price rise. Investors who recognized this opportunity reaped the benefits of a substantial market rebound.
- 2009: Seizing the moment. During the 2008-2009 global financial crisis, the ratio crossed the 80 to 100x mark, paving the way for another spectacular silver rally. As market uncertainty took hold, investors turned to silver as a safe haven, causing its price to rise significantly. This event demonstrated the potential for silver to outperform during times of economic turmoil.
- 2020: a contemporary phenomenon. In the wake of the COVID-19 pandemic, the ratio once again ventured into the 80 to 100x range, catching the attention of investors around the world. As economic uncertainties loomed, silver staged a remarkable rally, confirming the pattern of recent decades. This recent event further reinforces the idea that the ratio can serve as a valuable indicator of potential silver price movements.
The gold-silver ratio and historic silver rallies
The historical evidence suggests that the gold-to-silver ratio in the 80 to 100x range could act as a signal of a major turning point in favor of silver. However, this ratio is not a timing indicator; a turning point can take months or even quarters.
Update July 16, 2024 – Gold/silver has fallen below 80 points since May and has remained below 80 points since then. This is an important evolution. It is latest news. Once below 65 points we predict that the target area indicated on the map will be hit: 40 points. This coincides with 48-50 USD/oz in the price of silver. A potential historical Silver Rally is just around the corner?


Anecdotally, after three years of silence on silver prices, the Wall Street Silver group is once again tweeting about silver prices. Not only that, their focus on a “silver squeeze.”
Gold and silver cards
We looked at one specific ratio chart above: the ratio of gold to silver. It is also insightful to compare the gold and silver price charts separately.
The pitfall to avoid: choose the right time frame, and certainly don’t choose lower time frames.
Below is an interesting post on X highlighting the gold price charts and the longer term silver price charts:
$SILVER is in historic, long-awaited escape mode.
With gold’s mega breakout seven months ago, the PM bull resumed.
Now silver is about to follow gold.
I’ve been saying for years that my minimum price target is 370, and that’s still true.
There has honestly never been a greater opportunity. Or threat. pic.twitter.com/Bs1nSkC9d6— Graddhy – Raw Materials TA+Cycles July 12, 2024
As you can see, silver is lagging behind gold. This is exactly what the gold-silver ratio chart tells us. Silver will have to catch up, which will happen sooner or later. In that scenario it will fall below 65 points (as described above). This will lead to a silver run towards the $48-50 area.
Our premium gold and silver market reports cover the key indicators of gold and silver prices every week. Gold and Silver Market Reports >>


