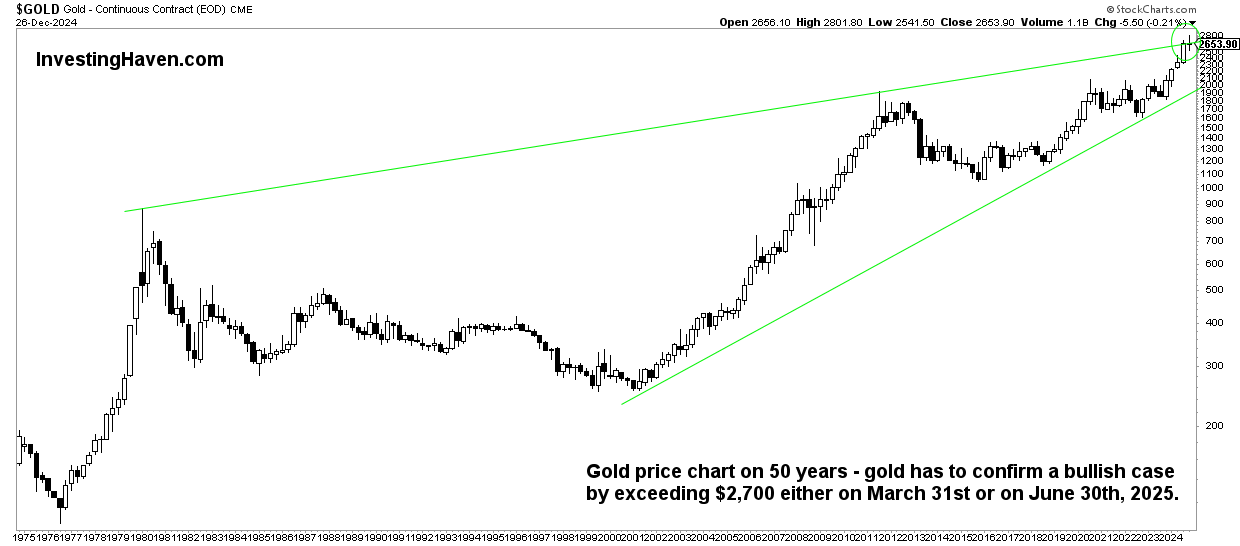
Gold will confirm its long-term bull market once it crosses $2,700 per Ounce on March 31 or June 30, 2025. It will be bearish if it falls significantly by those dates.
Gold has a beautiful long-term chart.
- We continue to see a great outcome for gold, ending up near $5,000 per Ounce sometime before 2030.
- A detailed analysis of why we are bullish on gold with gold price goals in the neighborhood of $5,000 can be found in our gold price prediction.
It is wise to always assess the possible outcomes. That is not only the expected outcome (bullish in the case of gold), but also the unexpected and unwanted outcome (bearish in the case of gold).
Long-term gold bull market on the 50-year chart
For clarity on the long-term trend, we need to look at the longest time frames. Below you will find the 50 year gold chart.
While many analysts focus on technical indicators or fundamental data points, we believe there is a much more effective way to assess trends: simple and pure chart analysis.
That’s because the chart reflects buying and selling decisions, not opinions or expectations. Furthermore, and very importantly, the nature of the pattern reveals consensus between buyers and sellers – a smooth chart pattern confirms consensus (the opposite is also true).
That said, we annotate this long-term gold chart and find one and only one pattern that really matters in confirming gold’s long-term bull market.


Long term gold bull market – confirmation
There is one important chart pattern visible on the long-term gold chart: it is a long-term gold bull market pattern: the cup and the handle.
More importantly, the cup and handle on the gold card have a very long service life. Above all, it is a flowing pattern.
The longer a pattern And the smoother a pattern, the higher the level of trust And the more powerful.
In the case of gold, this long-term smooth cup and handle, by definition a bullish pattern, adds to the confidence that gold is experiencing a long-term bull market.
As explained in detail in Gold Is Expected to Set a New ATH:
The gold cup and handle reversal pattern and gold’s long-term channel paint a promising picture for gold’s future prospects. Analysis of the gold price charts confirmed that a bullish breakout would occur in 2024, as early as 2023, it happened on March 4, 2024, a date for the history books.
The cup and handle breakout occurred on March 4, 2024. This resulted in a quick rally.
Gold is taking a break now, there is nothing to worry about and then healthy price action as well 5 consecutive green quarterly figures candles.
Our point is similar to this message:
$GOLD broke out in the fourth quarter of 2023.
This means that the secular bull market has resumed, plus the third and final bull phase has begun.
The margin expansion for many miners will be astronomical.
A lifelong opportunity and threat. Prepare yourself. #joinus pic.twitter.com/3JGjGTVp6F— Graddhy – Raw Materials TA+Cycles October 15, 2024
Long Term Gold Bull Market – Invalidation
How can we be sure that gold is in a long-term bull market?
If it is not invalid!
When would gold reverse its long-term bull market?
When the bullish pattern on the 50-year chart, as shown and discussed above, is no longer the dominant pattern, dominance is transferred to a bearish pattern. Which bearish pattern? The rising wedge is bearish by definition.
A potential A bearish wedge is visible on the long-term gold chart. Now a few notes about this pattern:
- So far, the country has not shown any form of dominance.
- It will become dominant once there are similarities to the big drops that marked a big top, in 1980 and 2011. As can be seen from the chart, a big drop within the quarter from the rising trend line should be the ultimate sign that there is is of a bearish trend. become dominant.
Let’s face it: if gold was going to turn bearish, it had ample opportunity to do so in December 2024. With a wild swing in both the USD and rates, gold could have crashed, leaving a pit on the quarterly chart similar to those seen in 1980 and 2011. It didn’t happen.
We believe the bullish cup and handle pattern is so much stronger than the potential rising wedge pattern.
We will know for sure that gold is bullish if it trades above $2,700 per Ounce on March 31 and June 30, 2025. This will be the ultimate bullish validation on the price/time axes of gold’s long-term chart.

