In summary, the bullish silver story will be confirmed if spot silver trades above $32.70 by February 1, 2025. This will confirm the silver ATH before summer 2025.
RELATED – When Exactly Will Silver Reach $50 an Ounce?
In this article we review 5 silver price charts.
They all consistently paint a bullish picture.
They visualize silver’s bullish story and confirm our bullish silver price forecast.
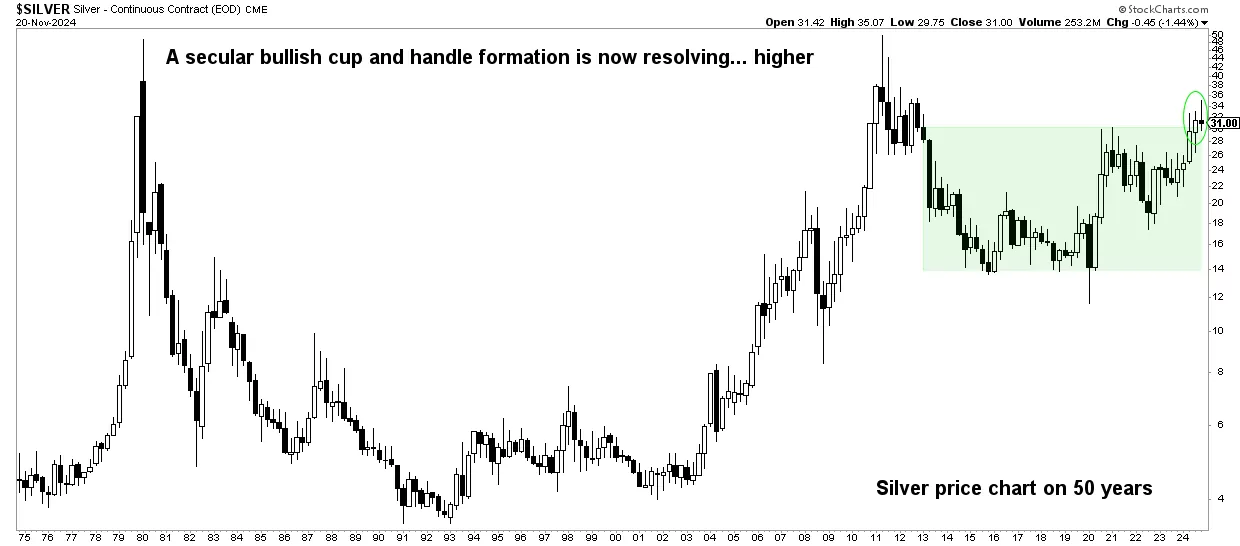
Bullish Silver story – the wildest cup and handle reversal in history
We’ve said it many times: the long-term silver price chart is unusually bullish.
We have made the point that this is the case cup and handle The reversal is so bullish that it could qualify as THE most bullish cup and handle formation in the history of the markets.
This is due to the unusual length of this pattern.
RELATED – Can Silver Ever Rise to 100 USD per Ounce?
The longer a pattern, the stronger it becomes.
The bullish silver story can be summed up with this one chart: the Silver price chart for 50 years.

Bullish Silver Story – Bullish Triangle Breakout
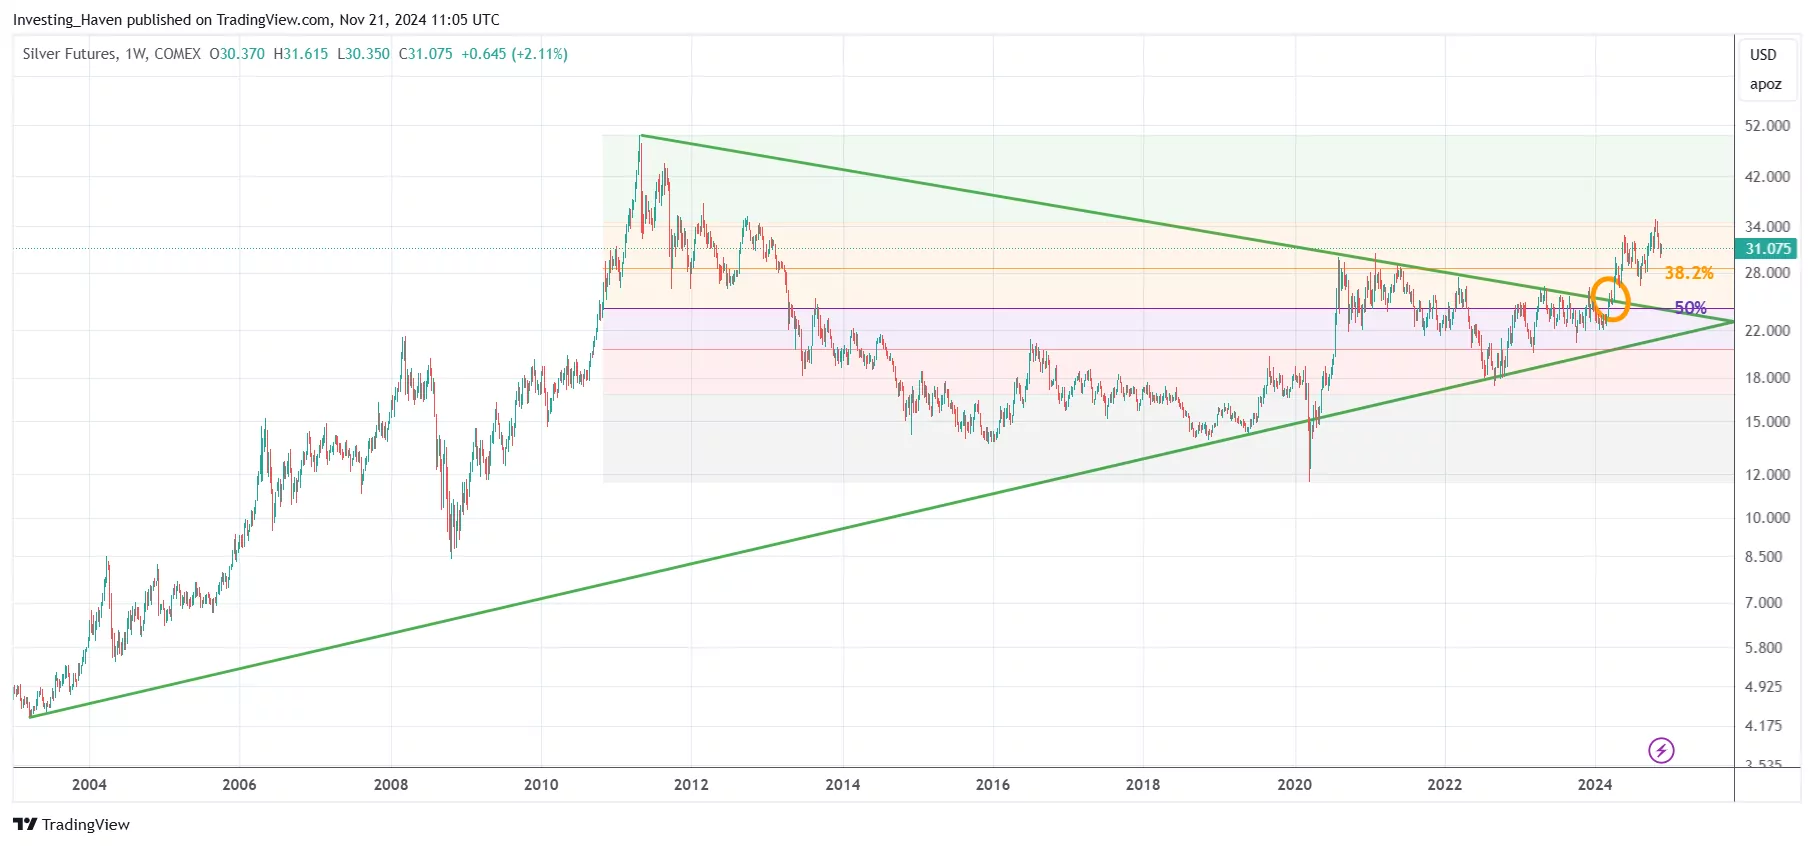
When switching from the 50-year chart to the 20-year silver chart, we cannot ignore the strength due to the bullish triangle outbreak.
- A bullish triangle breakout guarantees nothing in terms of price targets.
- Nor is it predicted exactly when a higher goal can be achieved.
- Equally important, it does not rule out a price drop.
What matters is the dominant chart pattern.
As can be seen from the 20-year silver price chart, the dominant pattern is very bullish for a number of reasons:
- The length of the bullish triangle.
- The clear breakout of the triangle.
- More importantly, the breakout of the triangle occurred right at the 50% Fib level.
Once silver broke out, it was in bullish territory from a Fibonacci perspective.
These reasons tell a bullish silver story on the 20-year silver chart.

Hidden bullish signal
Candlestick charts provide a wealth of insight.
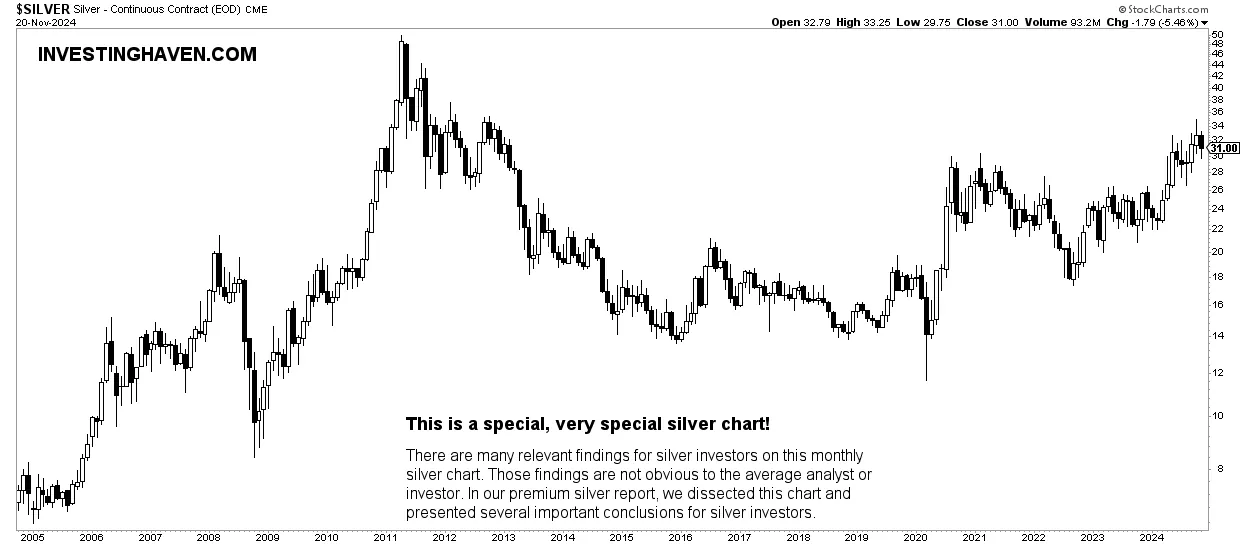
Similarly, the following silver price chart contains hidden signals.
They are bullish.
We have covered the chart insights we get from this silver price chart in our premium gold and silver service. While the details are reserved for premium members, the summary is as follows:
Silver will remain ultra bullish as long as it doesn’t break $26/oz.
There are bullish signals on this chart, quite hidden, available and visible at a specific point candlestick structure printed in 2024.

Bulls can write a bullish silver story in January 2025
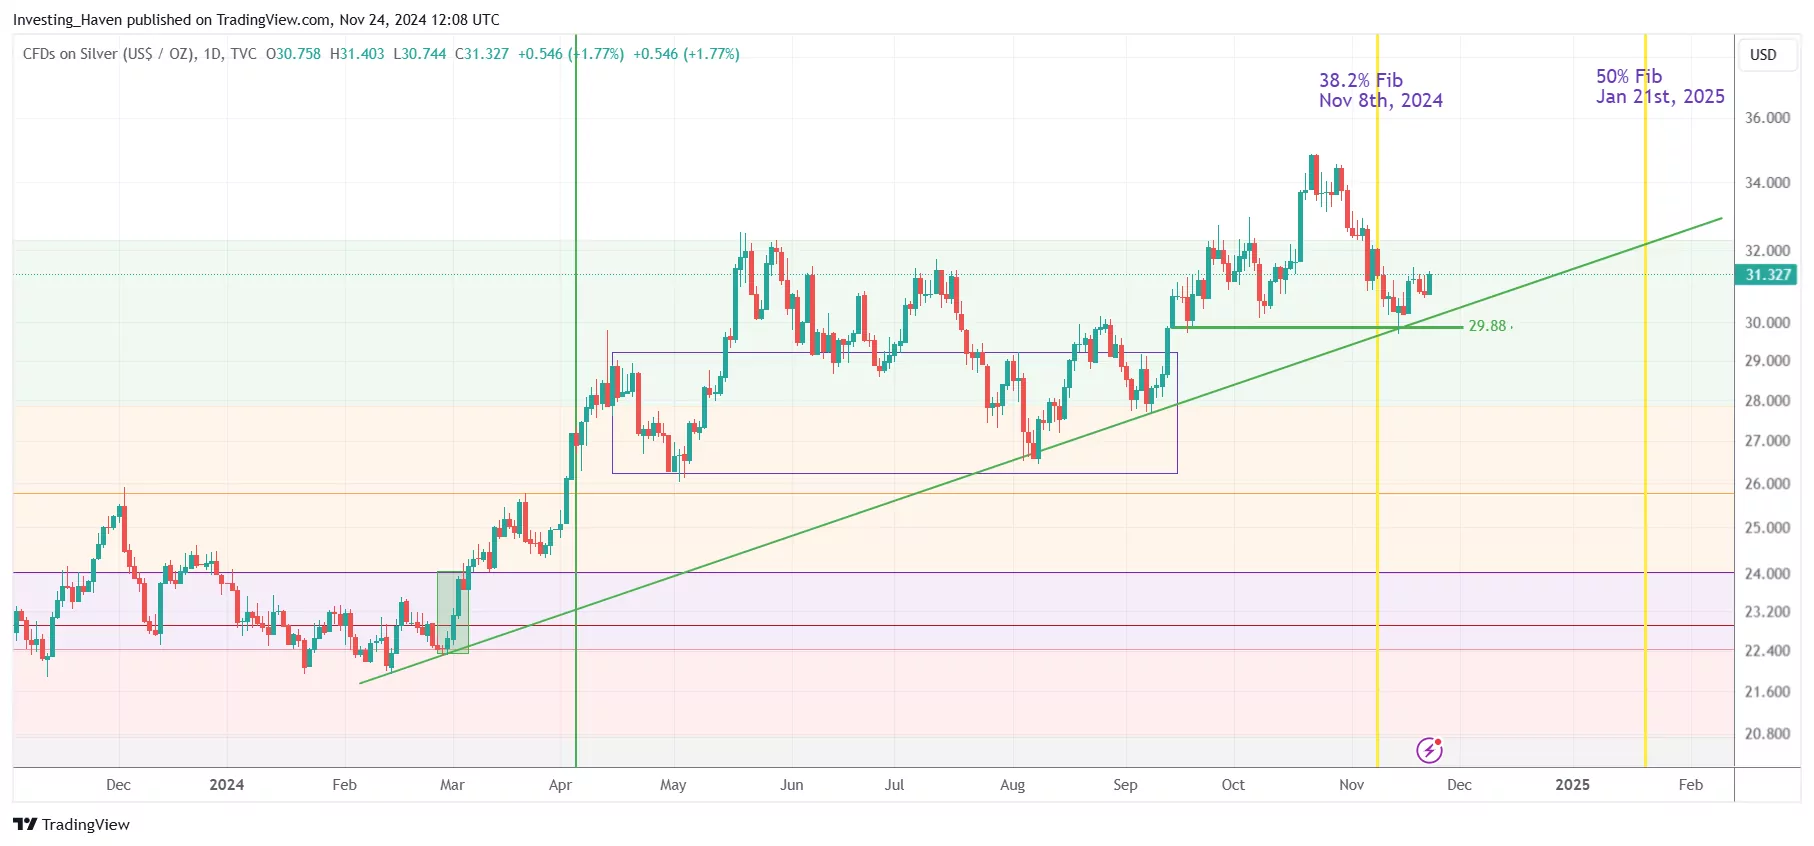
On the shorter time frame, there is one very specific date that is important to silver investors: January 21, 2025.
This is why: The most insightful Silver Chart analysis you will ever read
It has to do with Fibonacci and the timeline axis.
While the whole world is focused on Fibonacci on the price axis, we unlock more value by applying Fibonacci to the timeline axis.
Mark the following price and date – USD 32.70/oz as of January 21, 2025.
Silver has a unique opportunity to make history in 2025 by crossing $32.70 by January 21, 2025, which will push silver to ATH before summer 2025.

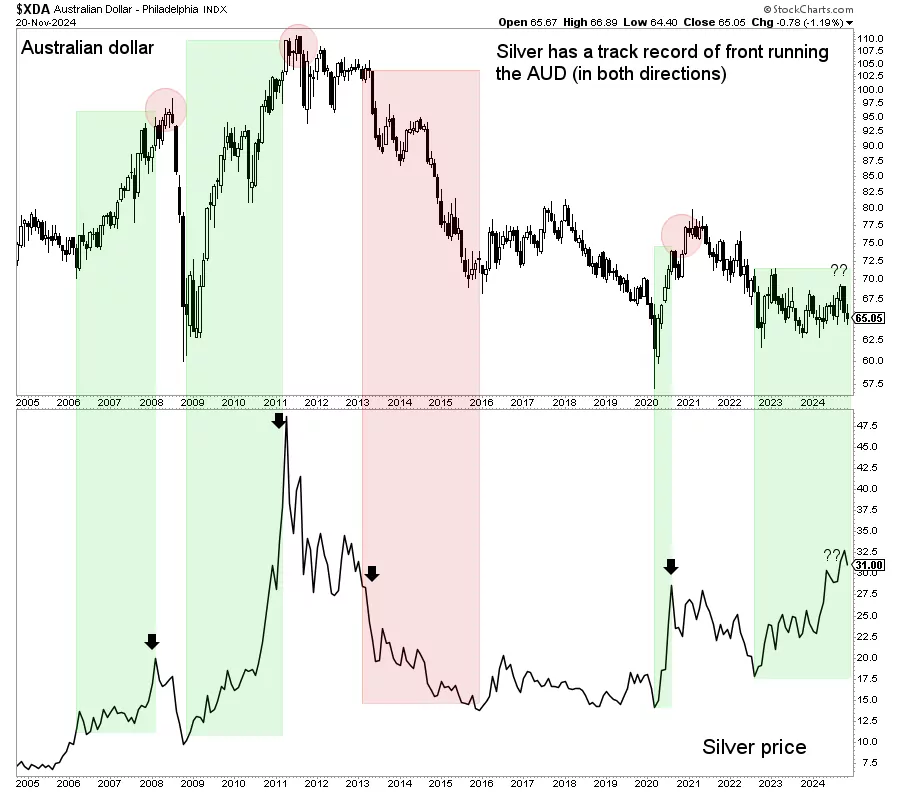
Bullish Silver story told by the Australian
What does the Australian dollar (Aussie, AUD) have to do with silver?
Very simple the AUD is correlated, directionally (not day to day), with the silver price.
The following diagram shows the correlation.
Takeaway: If the Australian continues to make higher lows, a structure he started creating since early 2023, it will bode well for silver.

Conclusions from the silver bull market
The silver bullish story is clear and distinct:
- The long-term pattern on the silver chart is unusually bullish. This one chart pattern in itself almost guarantees that silver will hit ATH sooner or later.
- The bullish triangle breakout occurred right at the key Fib level, confirming the silver bullish narrative.
- Confirmation of the bullish silver story could come if and when silver clears $32.70 by January 21, 2025.
The silver story is simple.

