A takeaway from the 50-year gold chart: a long-term bullish chart pattern completed in 2024. There are a few more insights from the long-term price chart of gold.
RELATED – Gold Price Prediction 2024 2025 to 2030
We live in a time of card overload. The number of gold cards appearing on various online outlets is causing a stir among gold investors.
- Gold investors should focus on a few charts, the gold charts that matter.
- In a top-down approach, the longest time frame that matters most is the 50-year gold price chart.
The 50-year gold price chart is the one that shows dominant gold trends.
Long-term trends form the basis for any healthy investment strategy.
We look at the gold price in this article, specifically 3 different variations of the same 50-year gold price chart.
50 year gold price chart
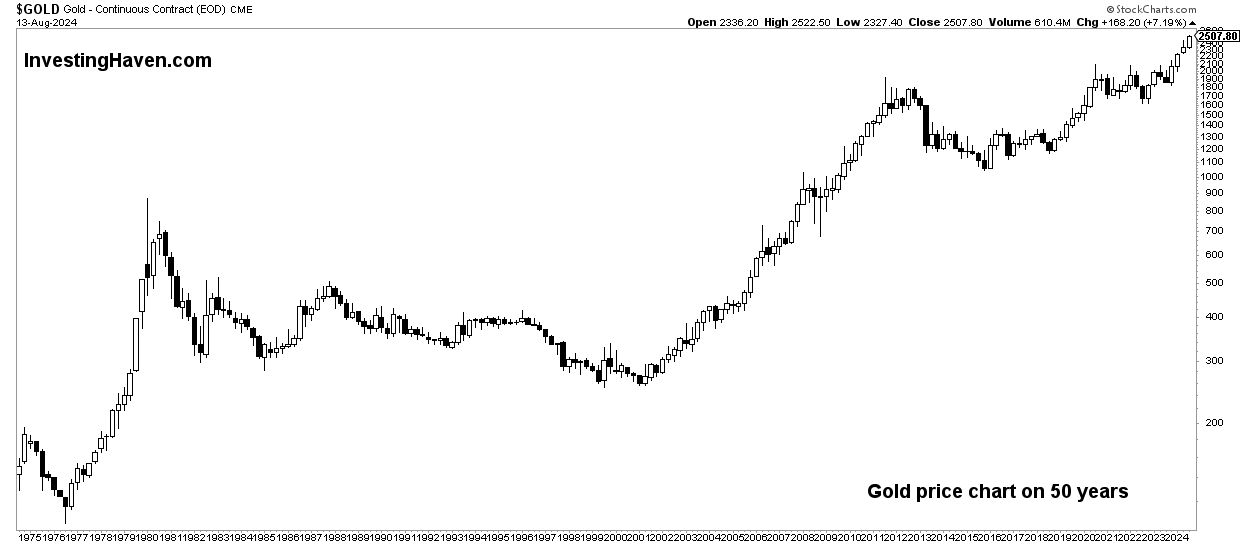
First, the 50-year gold price chart without annotations.
With a ‘keep things simple’ mentality, we look for the most obvious results from the table.
Essentially, the 50-year gold chart has four different phases, with the fifth just starting in 2024:
- A very strong increase in the 1970s.
- A rapid decline in 1980 marked the beginning of a long consolidation that lasted twenty years.
- A slower rise that took about ten years.
- A rapid decline in 2013, which set in motion a consolidation that lasted ten years.
It is likely that a new upward trend will have started in 2024.
Takeaway #1 from the Gold Price Chart of the Last 50 Years: Over the Long Term, Uptrends Get Softer and Consolidations Get Softer.

Phases on the 50 year gold price chart
We take a closer look at each long-term phase printed on the 50-year gold price chart. We play gold back history by simply reading the chart patterns.
1970-1980: an epic rally
The gold price was in a very steep uptrend.
It reminds us of Bitcoin in a way.
Inflationary pressure was the catalyst.
The Fed put an end to the parabolic rise in gold prices in 1980 by raising interest rates to 17%.
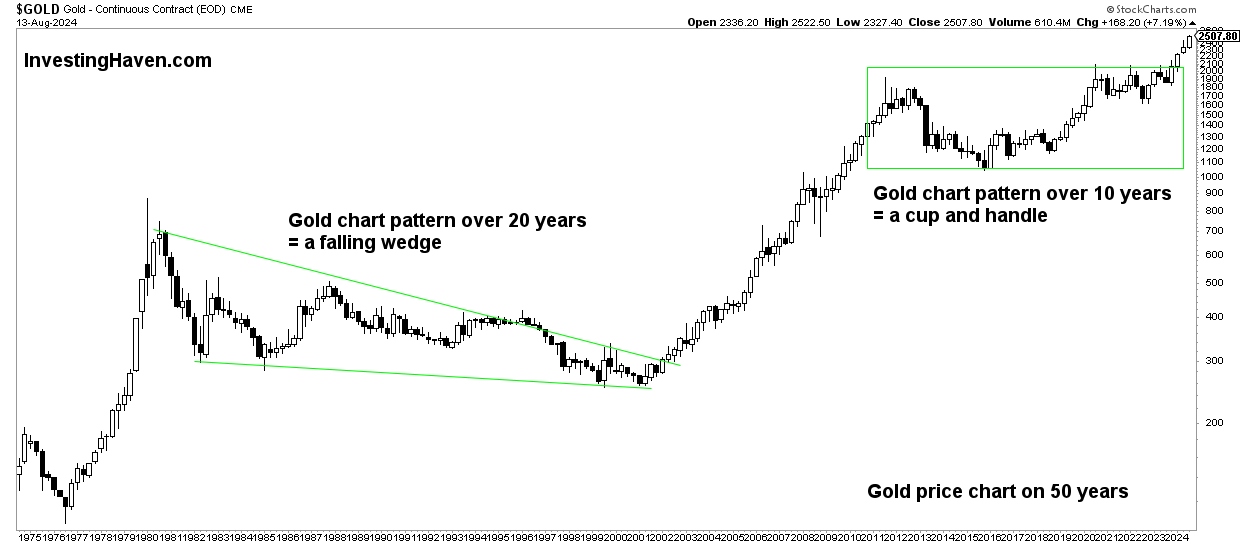
1980-2001: An epic consolidation that turned into a bullish falling wedge
It took twenty years for the bear market to complete.
A careful look at the structure of the bear market reveals a falling wedge. This is a bullish pattern.
The longer it takes for a pattern to complete, the more powerful the subsequent trend. Because the falling wedge is bullish, the subsequent bull market was very powerful: gold started an unusually long ten-year bull market.
2001-2011: An epic 10-year bull market
A 10-year bull market is unusual, especially for a commodity.
Gold started to rise after the stock market crash caused by the dotcom crash.
2013–2023: A consolidation that turned into a cup-and-handle card formation
Interestingly, the second secular bear market for gold lasted ten years:
- The bull market that preceded it lasted ten years (2001-2011).
- This bear market lasts half as long as the previous one (1980-2001).
Whether there is a secular dynamic or not is unclear.
The bottom line is this: the consolidation turned out to be a bullish cup-and-handle formation. The duration of this consolidation is long enough to ensure sufficient bullish power for the subsequent bull market.

A new gold bull market
A new gold bull market was confirmed from March 4, 2024. It is clearly visible on the 50 year gold price chart.
RELATED – Is Gold Expected to Hit New All-Time Highs (ATH)?
As shown on the 50-year gold chart, the 10-year consolidation was completed on that date: March 4, 2024.
On that date gold came into a new one bull market especially after it cleared out its former one ATH.
2024 marks the beginning of gold’s third secular bull market.
Dynamics on the 50-year gold chart
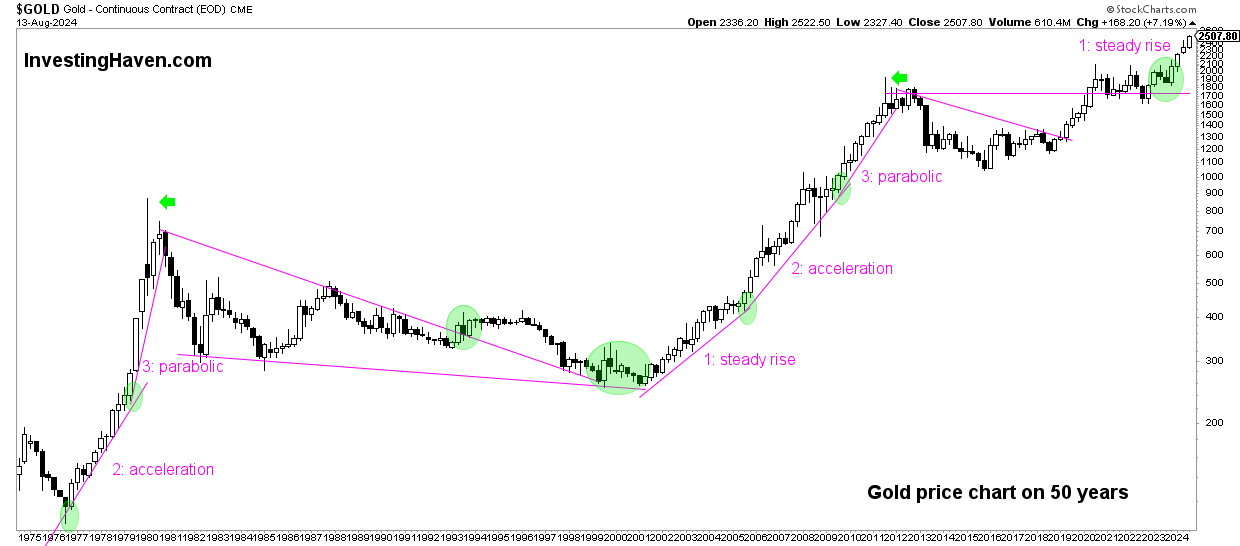
Gold bull markets usually rise in three phases. Each stage is less aggressive as it rises, a little slower and not as steep in slope. The gold rally in the 1970s was very steep and exponential, unlike the rally that started in 2001.
The consolidations tend to have similar bullish chart formations, but with different structures:
- A falling wedge, bullish.
- A head and handle, bullish.
Due to the bullish nature of both patterns, the subsequent bull market typically proceeds in three phases:
- A steady increase.
- A gear higher.
- The parabolic part completed after blowing off the top.
The strong rallies occur in a minority of cases, especially in phase 3 of an uptrend. That’s when the most money is made.

The behavior of the gold market during these phases highlights a specific dynamic:
- Gold bull markets typically unfold in three phases: a steady rise, an acceleration, and a parabolic phase that culminates in a breakout stop.
- The current state of the gold market indicates that it is in a phase of steady increase, consistent with previous bull markets.
The current state of the gold market indicates a steady rise, consistent with previous bull markets.
We are convinced that there is much more room for upside potential for the gold price.
The future of gold looks bright for long-term investors
Given the historical trends and current chart patterns, the long-term outlook for gold remains bullish.
Investors can expect continued upside, albeit at a potentially slower and more steady pace compared to the past. The observed bullish chart formations, such as the falling wedge and cup and handle, indicate strong potential for significant gains in the coming years.
By understanding these long-term trends, serious investors can make informed decisions and take advantage of the opportunities presented by the gold market.
Weekly gold and silver price analysis
As a premium service, we offer detailed analyzes of gold and silver prices. Every weekend we discuss the leading indicators of the gold price and the silver price. Us premium gold and silver market report >>


