The price of silver is lagging behind. While gold is setting a series of new ATHs, silver is still 40% below its ATH. What’s wrong with silver? The short answer: nothing. Silver lags because it tends to outperform during, rather than at the beginning of, a gold bull market.
RELATED – Silver Price Still 42% Below ATH – Why This Isn’t Sustainable.
The silver price has to play a mental game with both bulls and bears.
That’s how it should be. In the end, silver is the restless metal.
Furthermore, our last silver forecast was very clear: silver is not ready to go to $50 per ounce in 2024. It is likely to consolidate to ‘enable‘ a rally to $50 by 2025.
The great gold bull market
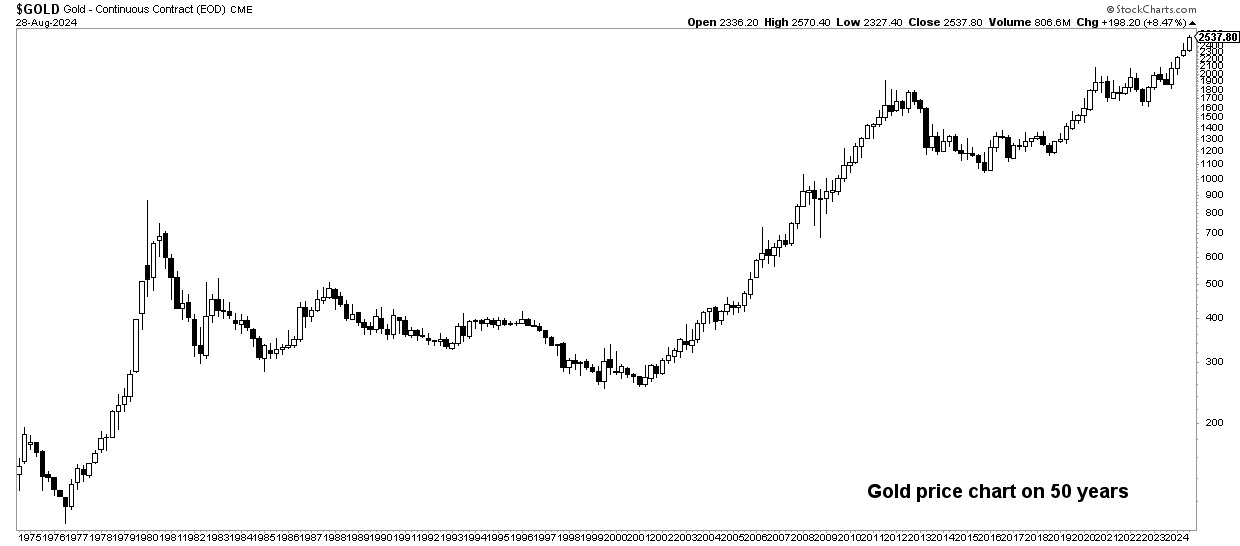
As this 50-year gold price chart shows, the great gold bull market continues.
After a hiccup in the previous decade, followed by a consolidation in 2022 and 2023, gold is now set to rise further.
We believe that gold will retreat at some point, but not to the extent that it will violate its uptrend. This is why:
The long-term bullish cup and handle are phenomenal.
The longer a bullish pattern, the stronger the uptrend.


Silver tends to lag behind gold
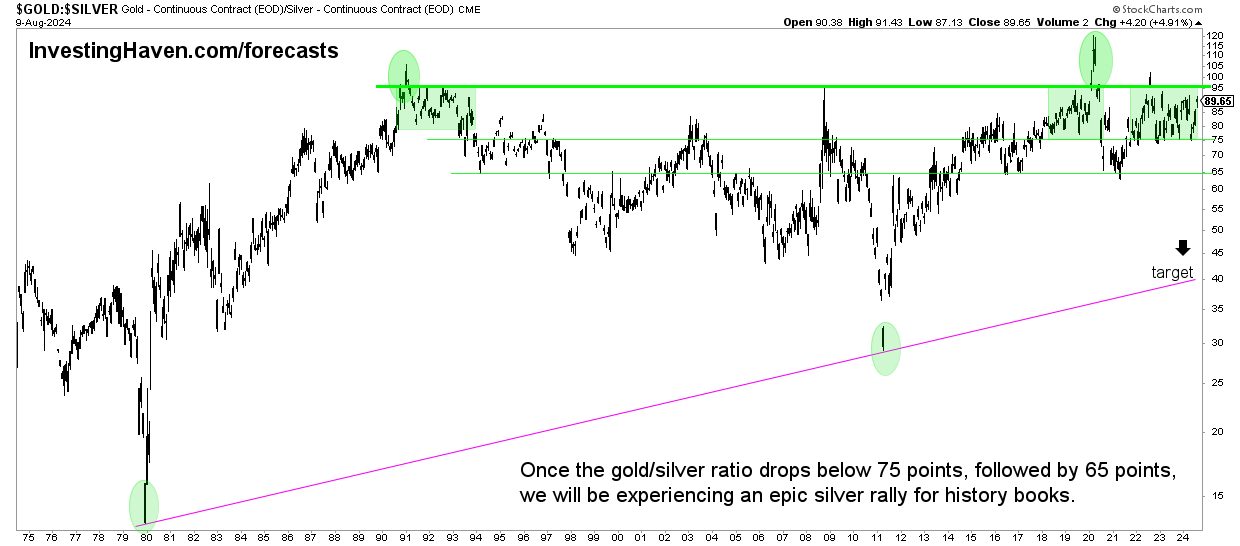
If we look at the price ratio between gold and silver, as shown below, we see a few lower peaks (higher prices for silver):
All those years coincide with a late-stage gold bull market.
It’s crystal clear: silver tends to underperform gold in the early stages of a gold bull market, and outperform gold in a developed stage of the gold bull market.


Silver – the calm before the storm?
That’s what we believe – the storm will come – it will be a ‘bullish storm’ so to speak.
RELATED – Will Silver Ever Reach $50 at a Time? Here you will find the answer and the must-see graphs.
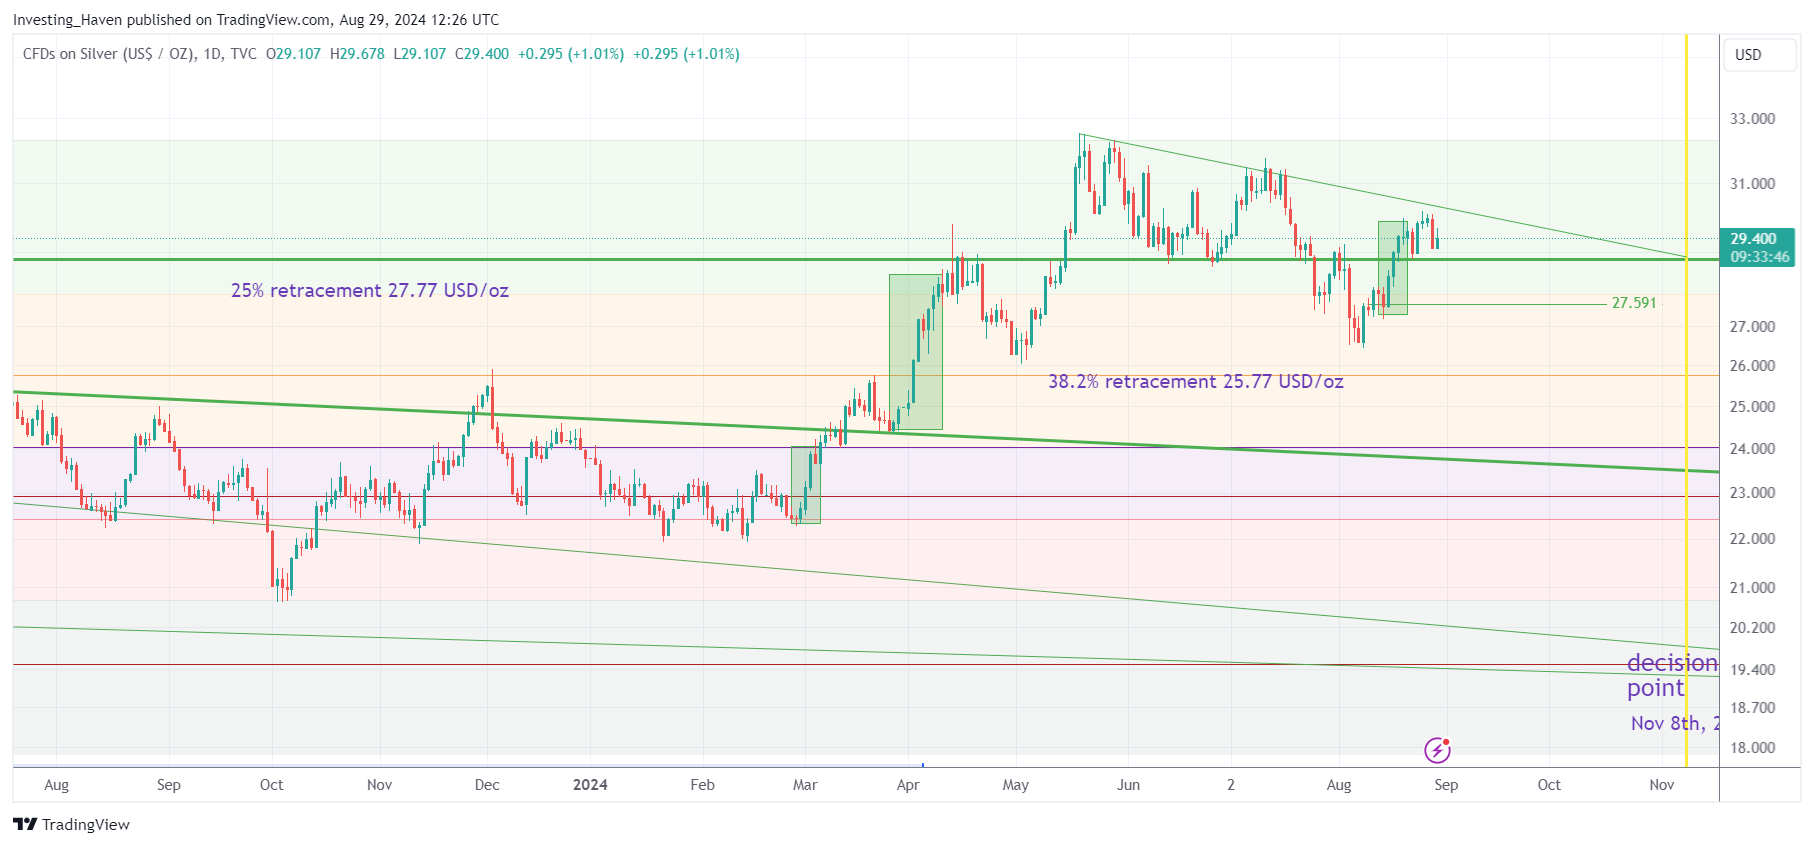
The silver price chart contains some interesting findings:
- It is consolidating above the secular breakout level of USD 28.80/oz. Silver has not structurally broken through this secular breakthrough point.
- Silver is consolidating above the Fibonacci retracement highs.
- There is a descending trendline as the 2024 highs were established in May/June, which will act as resistance until consolidation is strong enough for a breakout.
More importantly, November 8, 2024 is just two months away. Why is this important? This is why:
The most insightful Silver Chart analysis you will ever read (Linkedin by InvestingHaven)
To remind: It is very unusual for us to publish critical timeline insights in the public domain. These types of insights are reserved for our premium gold and silver research members.
That said, there is absolutely nothing wrong with the silver price chart, especially considering that there is still a decision point ahead of us.


Silver – what’s going on?
The short answer: there is nothing wrong with silver.
As mentioned, historicallyThe expected behavior is for silver to lag gold… until silver outperforms gold, which typically happens in a developed phase of a gold bull market.
Furthermore, the silver price chart looks solid; there is still a decision point before us.
In a sense it would have been ‘uncomfortable‘ isf silver has already reached $50 USD per Ounce.


