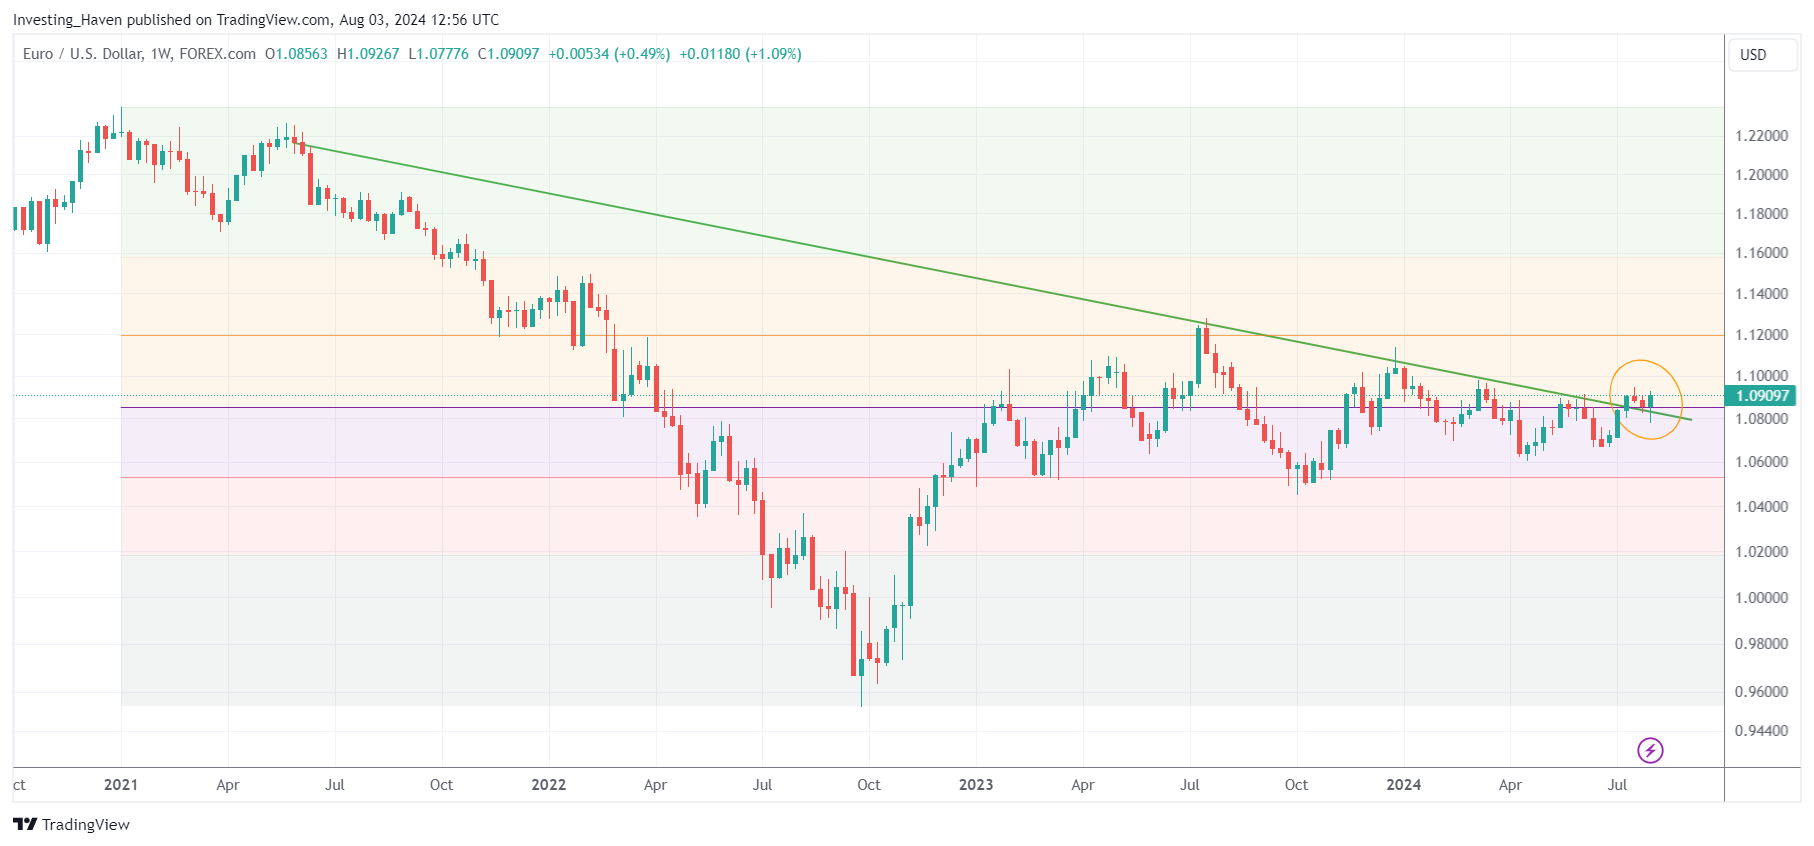
We believe gold will rise if the euro confirms the breakout that started on August 2, 2024. However, gold’s upward adjustment could come with a delay.
RELATED – Will Gold Ever Reach $3,000 an Ounce?
The basis for this article is the historical positive correlation between gold and the Euro, which stems from historical evidence that the USD and gold are inversely correlated.
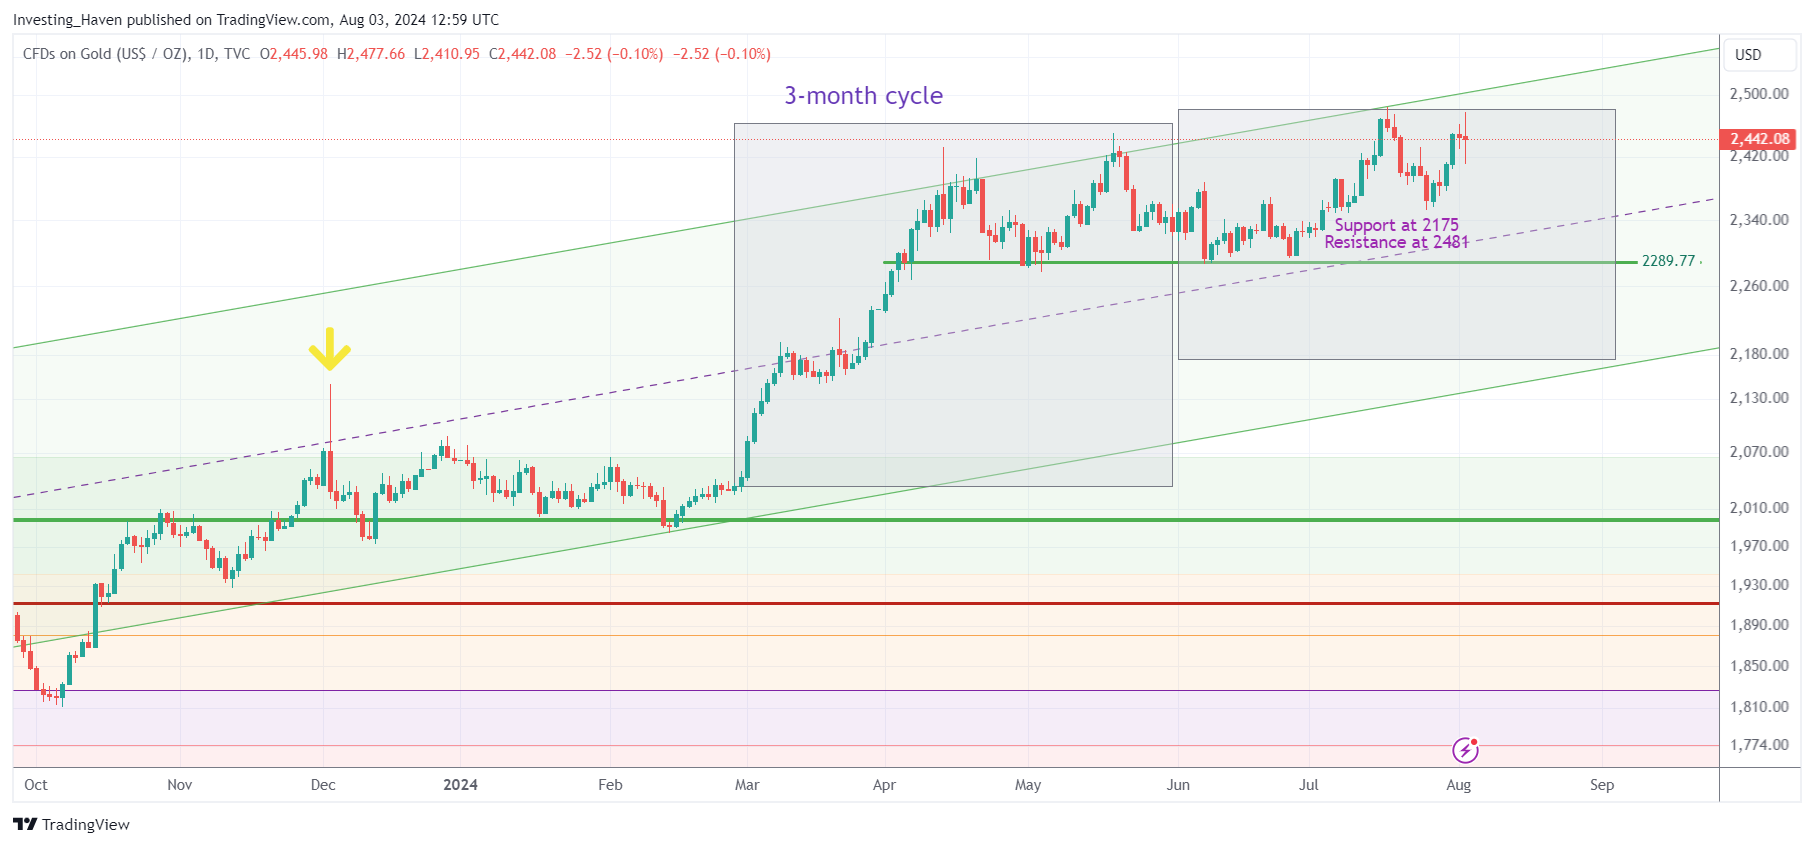
Gold price chart in an uptrend
The gold price has been in an upward trend since the first week of March 2024.
Although price action has been flat since mid-April, there is no evidence that gold has turned its uptrend into a downtrend. A consolidation is healthy in the context of an uptrend, not just in the gold sector, but in any market.
The rising channel of gold is the prominent feature of the gold price chart (XAUUSD).
Remark – the notes on this graph are ours, the cycle analysis is also based on our own calculations. This card, along with many other gold and silver cards, is featured each week in our premium gold and silver premium research notes (available in the private section of our site).


The euro is trying to break out
While the daily gold price chart looks better, the 10-year gold chart looks even better.
That’s probably because gold has gone through a very long (and therefore strong) bullish reversal. The delivery period was late 2023/early 2024.
It should come as no surprise that the Euro chart looks great at the moment. Gold and the euro are positively correlated, not in the short term, but in the longer term.
Below you will find the EURUSD weekly chart, with the key Fibonacci levels indicated by different colored areas. By far the most important level is the 50% Fibonacci retracement level (purple fine line). As we can see, the EURUSD is now breaking out, on its weekly time frame.
This is huge. Because it’s huge, the financial media doesn’t talk about it.
To remind – financial media (a) are lagging behind (b) are not focused on data points that are most important to investors (c) are unable to identify the important ‘events’ in the financial markets.


The returns cause volatility
So why isn’t gold ‘explosive’?
Ultimately, financial markets are forward-looking, so should gold investors anticipate the euro breakout that is now underway?
In our view, the threat discussed in this X-post is not justified. We are not perma-bulls of gold. We simply read the data and the leading indicators, and there is no threat to gold in the data at this point other than a healthy pullback that may occur.
$GOLD This very simple chart WILL come true.
Doubting this will be the biggest mistake of your life.
This chart is both the greatest opportunity you will ever have and the greatest threat you will ever face. pic.twitter.com/1DSoTZcWPF— Graddhy – Raw Materials TA+Cycles August 1, 2024
So why isn’t gold rising fast now? In our opinion, the correct answer is Revenues:
The yield is moving too fast. When interest rates change quickly, they prevent other markets from trending; they tend to create volatility in all markets.
Moreover, the yen, the carry trade, breaks out. This, combined with currently rapidly changing returns, prevents stocks and commodities from creating trends in the short term.
We explained this in detail in our latest gold and silver research report entitled ‘The Markets’ Predicted Volatility Window Has Arrived, Leading to Consolidation in Precious Metals’ (login required).
We’ve shared a few more data points that help us understand how strong the expected uptrend in gold and silver will be (hint: they’re vastly different based on their leading indicators).
For now, one of the few areas of focus for gold investors should be the evolution of the euro breakout. This should be combined with analysis of gold and silver’s leading indicators, especially the data points we discuss in our research notes every weekend. Equally important: checking price action on a few decisive dates that come from the timeline analysis – this is how we practice silver timeline analysis on InvestingHaven.com)

